LOCAL OLLAMA + DEEPSEEK ANALYTICS

AI-powered business intelligence and data visualization

Chexi BI lets teams upload Excel/CSV files, build visual dashboards, and analyze data in natural language with locally deployed Ollama and DeepSeek models. Private deployment and access isolation keep enterprise data within controlled boundaries.

Excel/CSV uploads Local AI models Private deployment
Chexi BI conversational analytics assistant with MCP tools and execution tracing
Analyze business data in natural language
Ollama + DeepSeek
Local conversational BI
Excel / CSV
Start analyzing quickly
Apache Superset
Mature visualization foundation

Features

From question to dashboard in one workspace

Bring AI assistance, data exploration, and organizational permissions into one environment to reduce tool switching and repeated communication.

01 / AI

Intelligent analysis with AI Agent

Describe analysis goals in natural language and let the Agent become a conversational entry point to data exploration.

Explore AI Agent →
02 / VISUAL

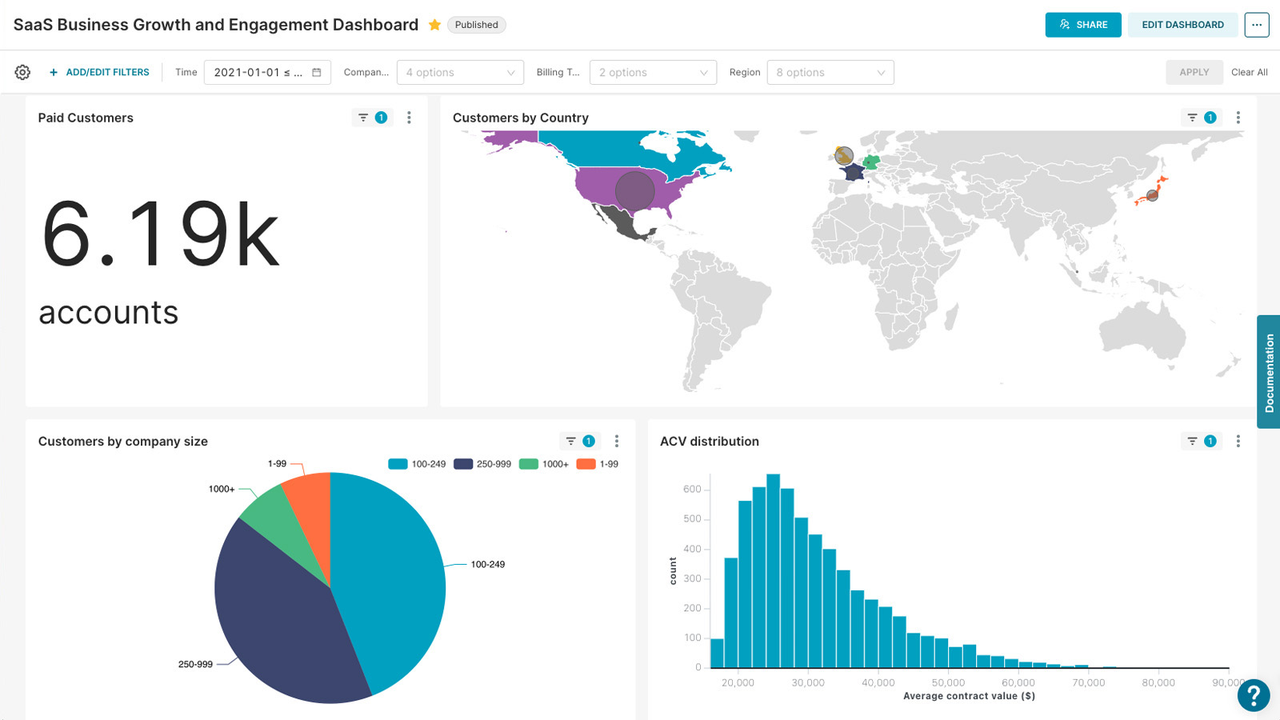
Charts and dashboards

From rich charts to composable dashboards, keep key metrics visible and traceable.

Explore visualization →
03 / ACCESS

Permissions and data isolation

Build access boundaries around users, roles, and data scopes for safer team collaboration.

Explore access isolation →
04 / FILES

Excel and CSV data analytics

Upload common spreadsheet files and turn scattered data into explorable datasets, charts, and business dashboards.

Explore file analytics →
05 / LOCAL AI

Local Ollama and DeepSeek

Connect a locally deployed Ollama service and use DeepSeek models for natural-language data analytics.

Explore local models →
06 / PRIVATE

Private enterprise deployment

Run the BI platform, Agent service, and local model within infrastructure managed by your organization.

Explore private deployment →

Conversational experience

Start with a business question, not a button

Chexi BI connects to DeepSeek through a local Ollama service, providing a natural-language entry point while respecting existing data permissions.

Describe the analytical intentAsk what you need to know in business language
Use data contextAnalyze within accessible data
Return to the visual workflowConnect conversations with charts and dashboards
Chexi Agent · Analytics session
Review business performance by region this quarter. Which changes deserve attention?
I will summarize regional performance using data you can access and explain the key changes.

Get started

Start analyzing in four steps

01

Create an account

Create a Chexi BI account and enter your analytics workspace.

02

Upload or connect data

Upload Excel/CSV files or access data sources and datasets authorized by your organization.

03

Explore and ask

Start analyzing with the chart workspace or AI Agent.

04

Build dashboards

Organize important results into reusable dashboards.

Let your next analysis begin with a question

Create a Chexi BI account and experience analytics where AI and visualization work together.

Try Chexi BI Free